
MetricWorks
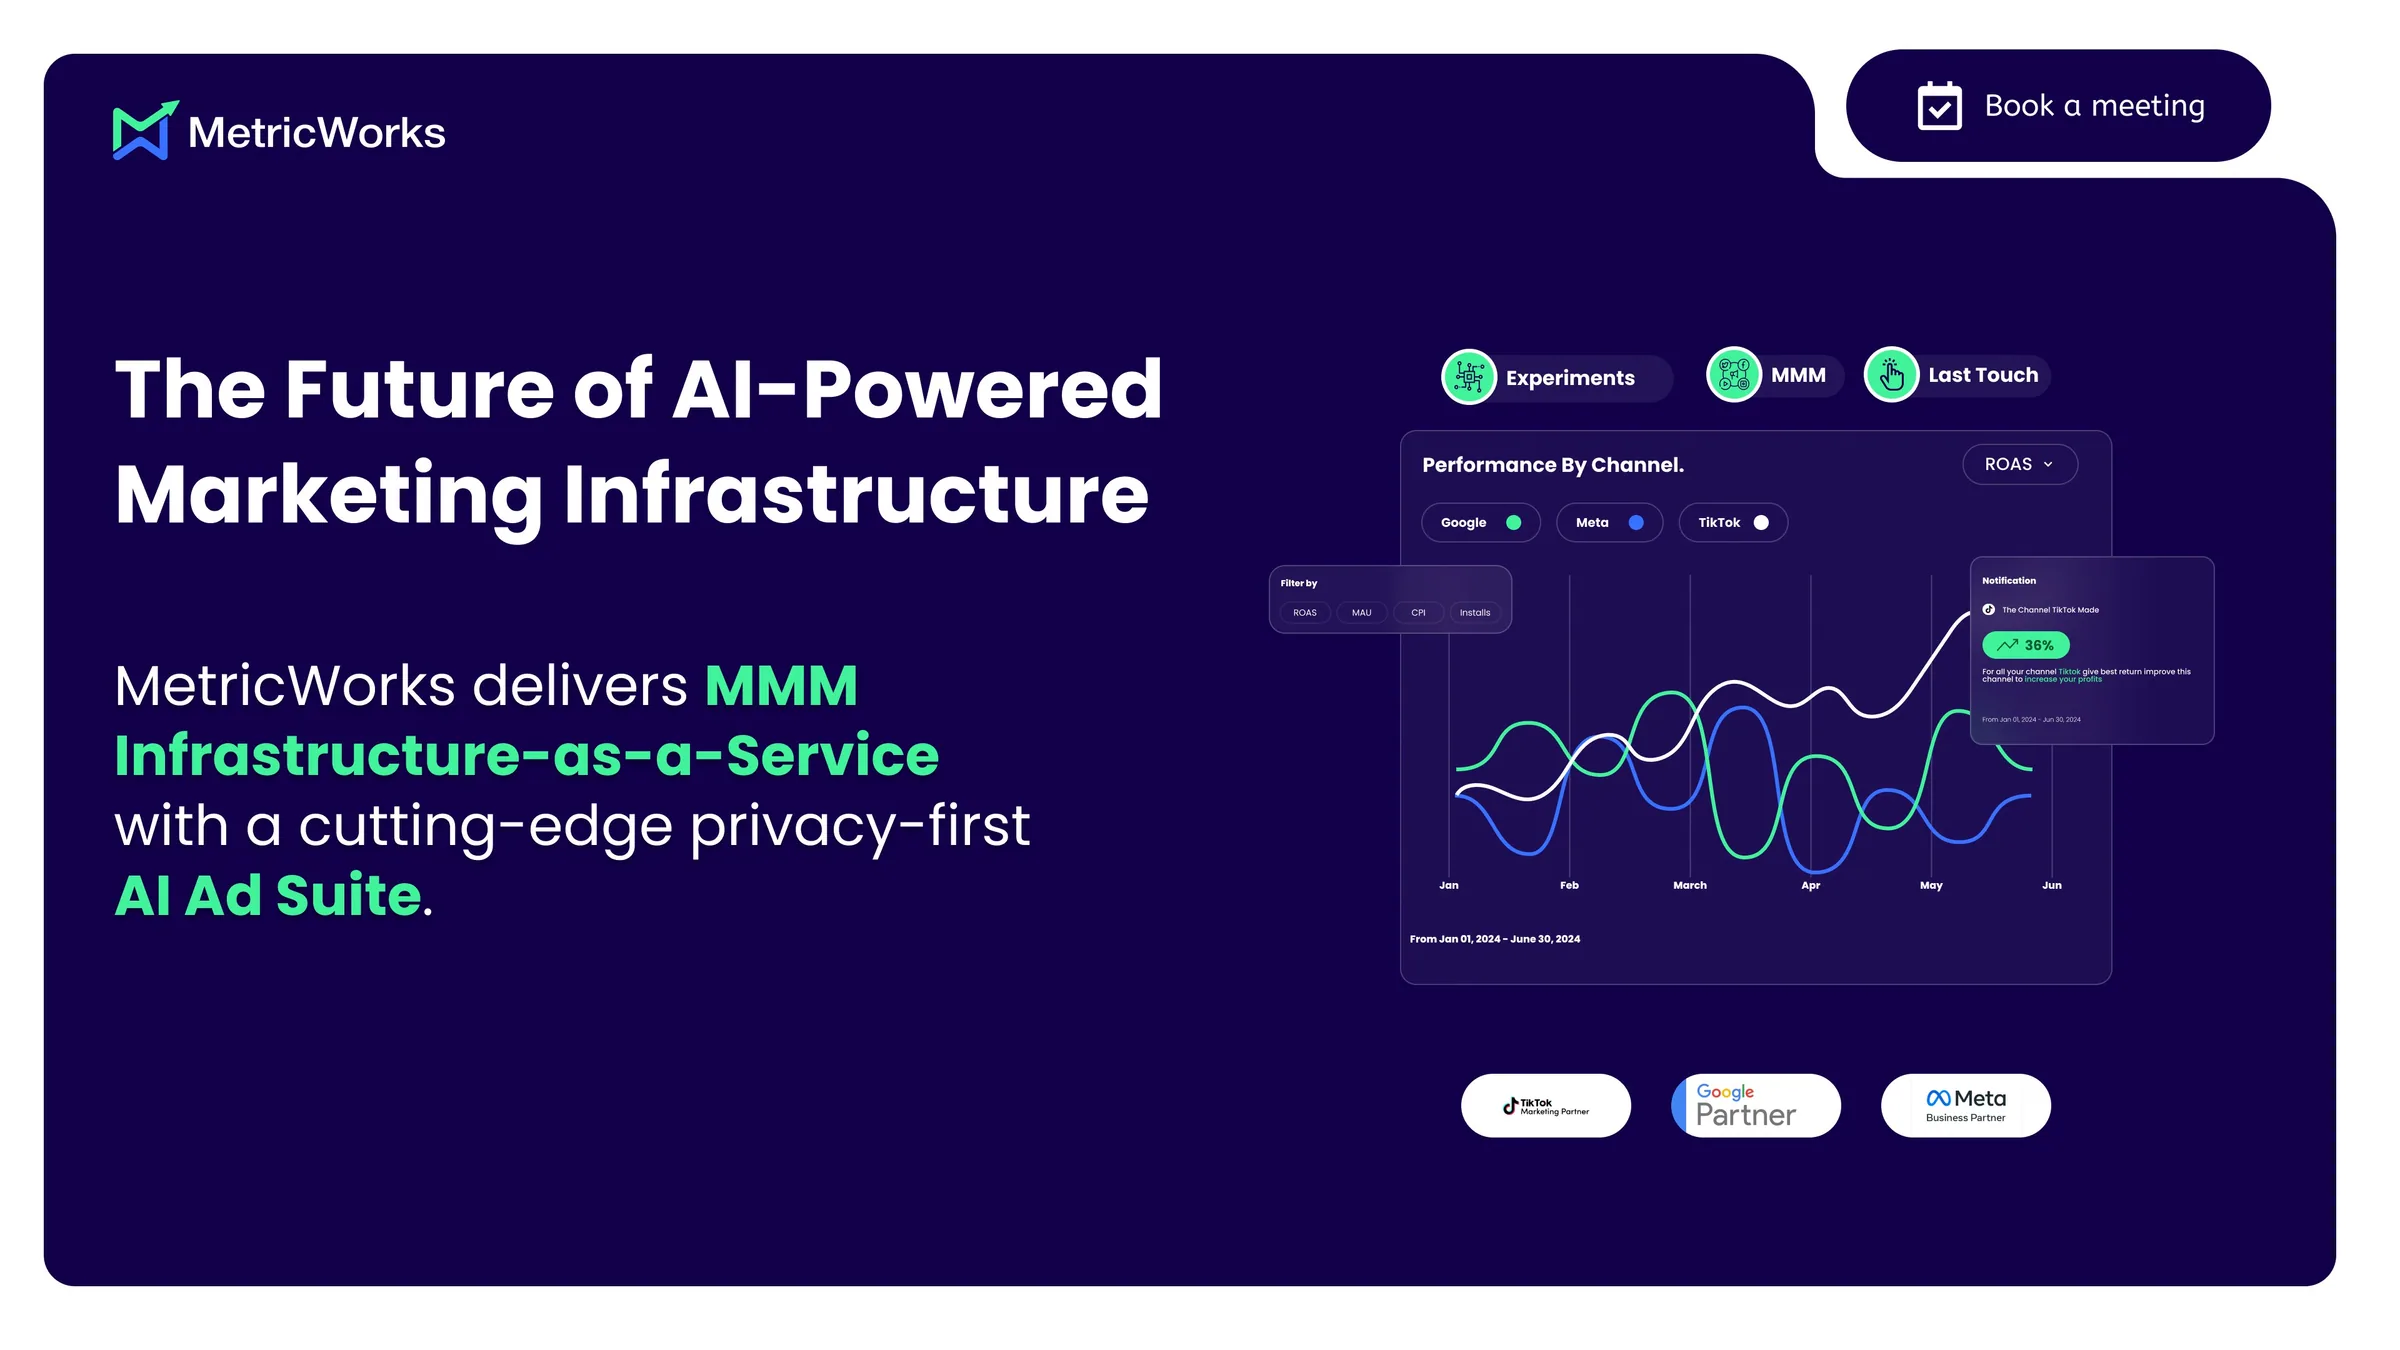
I came in to redesign a logo. I left having shipped 10+ product features to enterprise clients including Blizzard and Nexon.
- Work
- Design SystemDesign directionUser InterfaceVisual Design
- Tools



MetricWorks is a marketing intelligence platform for CMOs and growth teams at mobile gaming and app companies. It lets you run experiments across multiple products, channels, and countries simultaneously, then tells you which combinations actually drive revenue. The kind of thing that normally takes a team of data scientists, MetricWorks puts into a dashboard.

THE BEGINNING
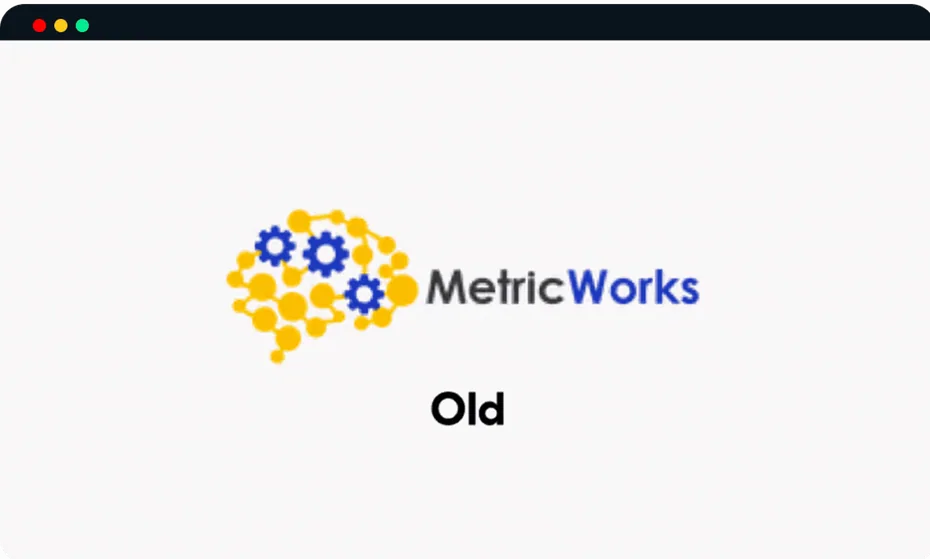
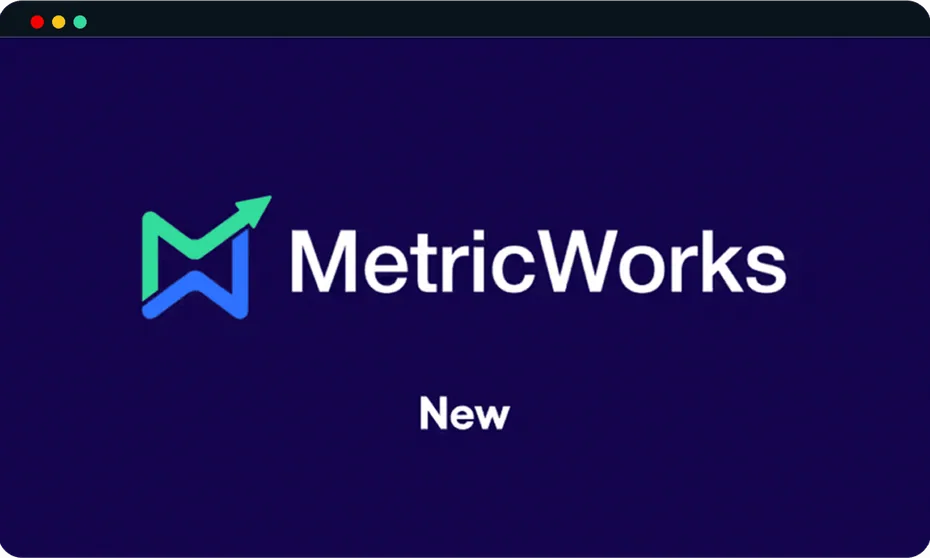
MetricWorks came through a referral. The initial ask was three things, brand refresh, pitch deck, landing page. Standard early-stage work.
The pitch deck was the hard part. The product is technically dense. The kind of thing that loses investors in the first two minutes.
We built a 15-page narrative around a problem every CMO in the room already felt. The round closed.
After that I met the CTO. That's when the real work started.
THE PROCESS
Once the brand was done, I was hired to work on product features with the CTO. The platform had no design system. No component library. No Figma file of the existing product. Screens had been built by engineers and never touched by a designer.
Before designing anything new I documented what existed. Every screen, every state, rebuilt in Figma just to have a baseline. Unglamorous work, but you can't improve what you can't see.
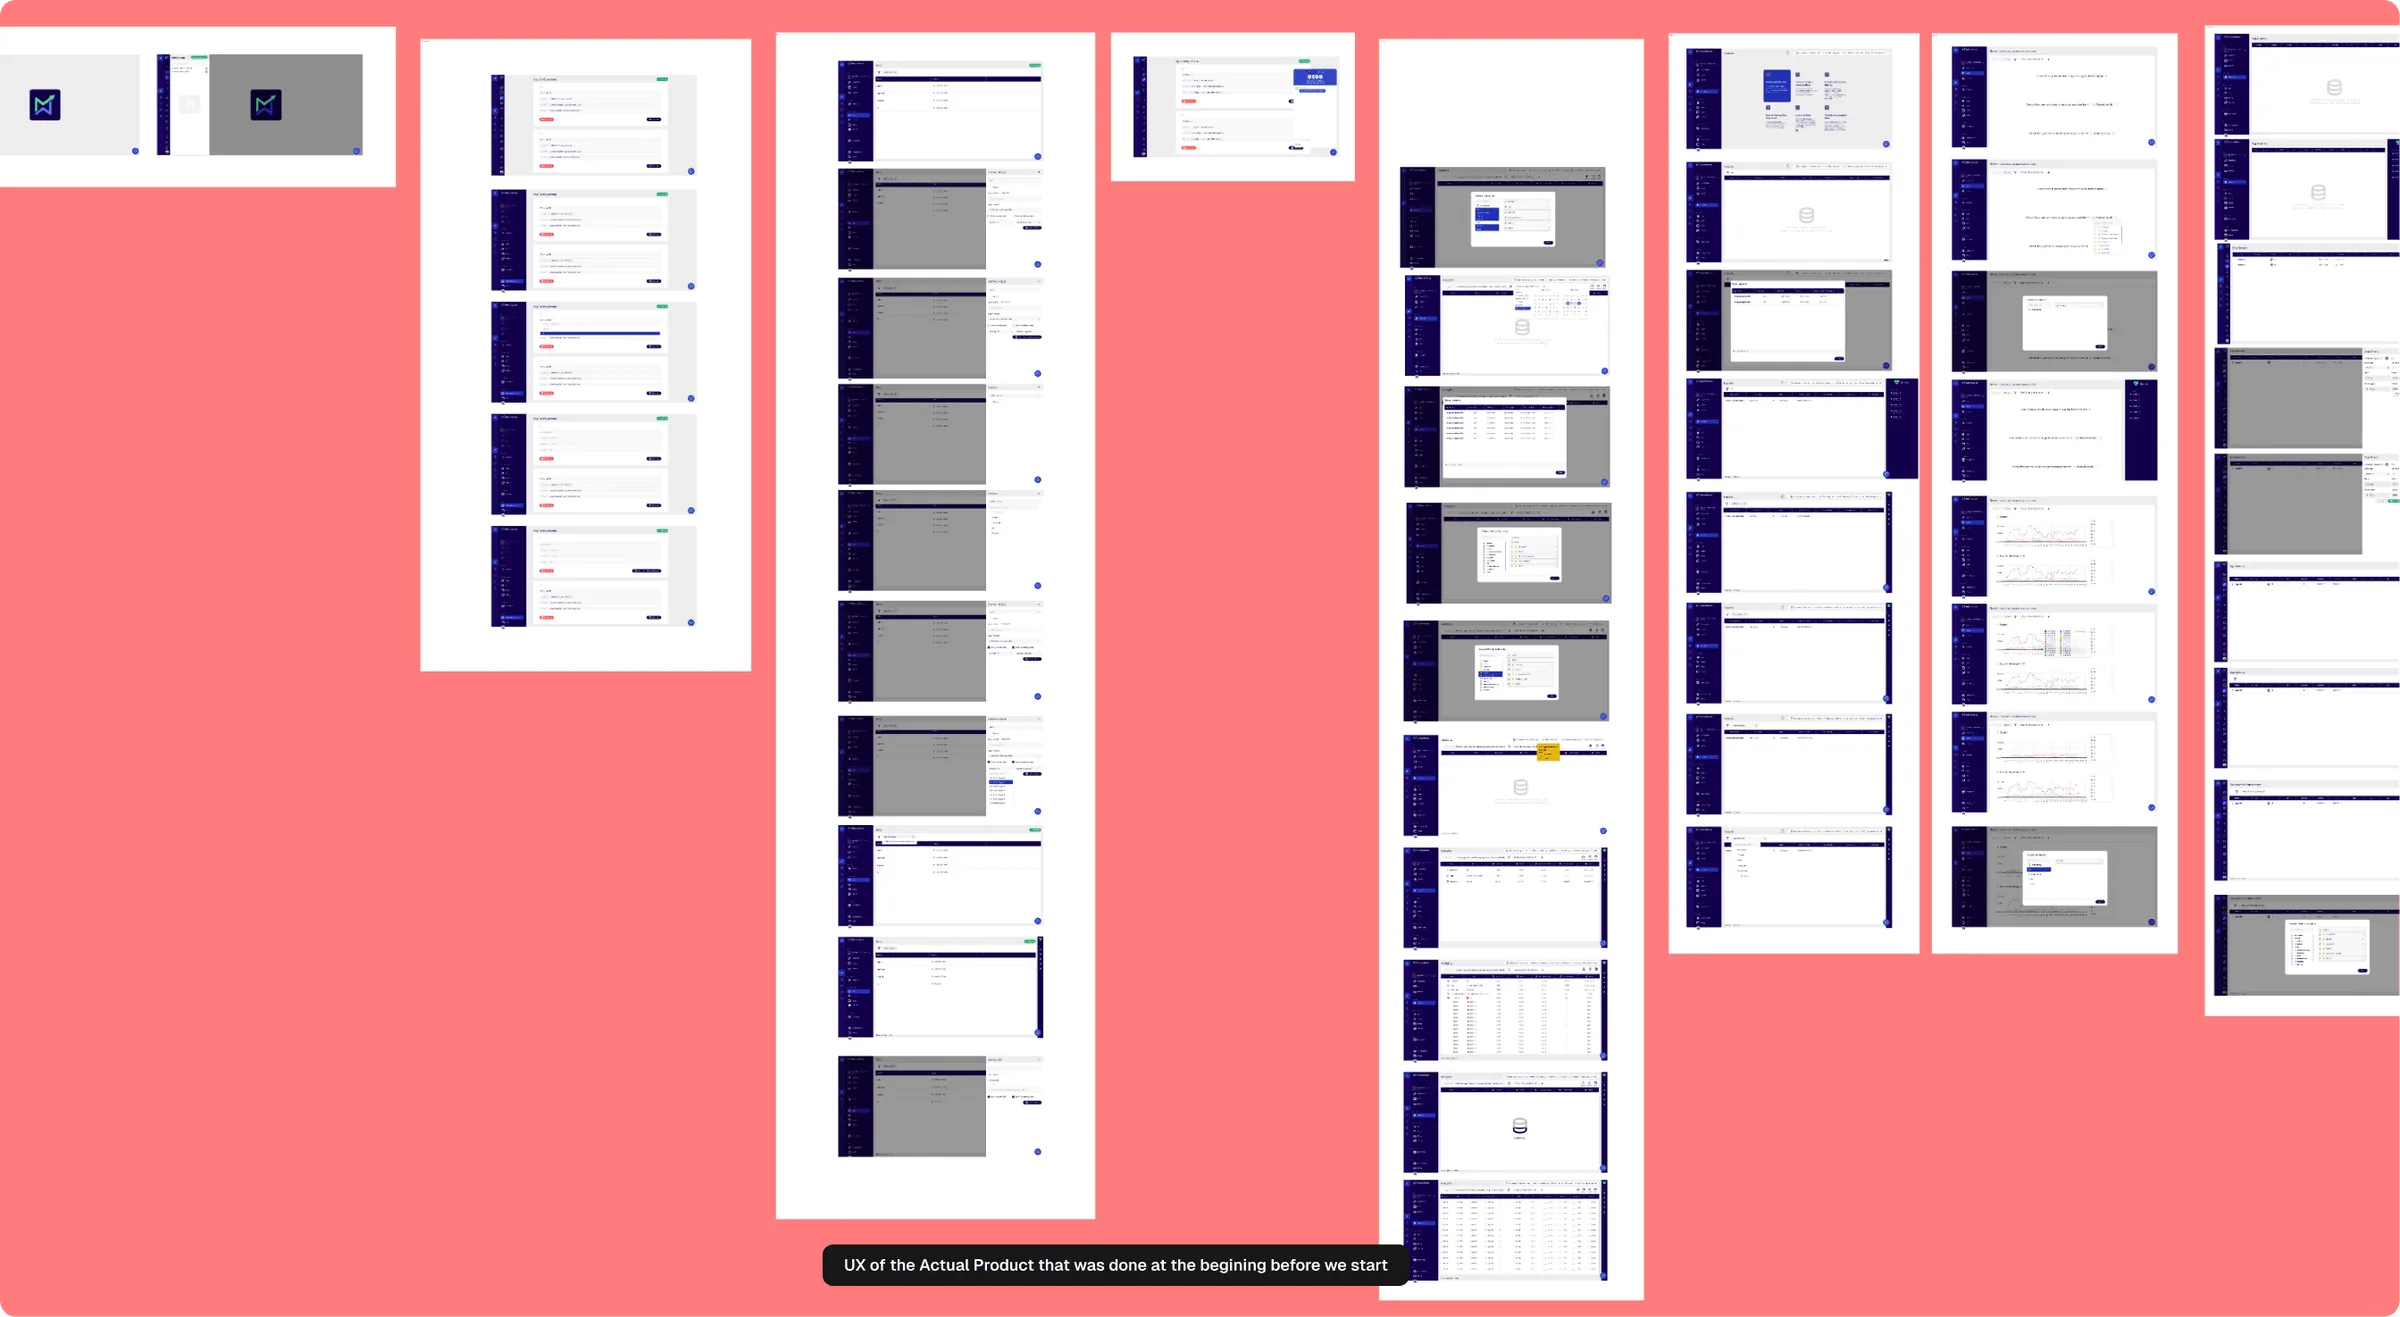
From there I worked directly with the CTO. Not in async reviews. In live sessions, sometimes hours at a time, moving through problems in real time.
He brought the product knowledge. I brought the design thinking. He taught me things like spacing multiplied consistently, radius systems that engineers can actually implement.
That dynamic shaped every feature we designed together. The work wasn't handed off. It was built in the room.
Every component was invented on the spot. Features moved fast, sometimes three a week, which meant decisions had to be made quickly and defended clearly.
THE WORK
We shipped multiple features, with the product focused on three main ones. Each one a different layer of the product's complexity.
Data Management
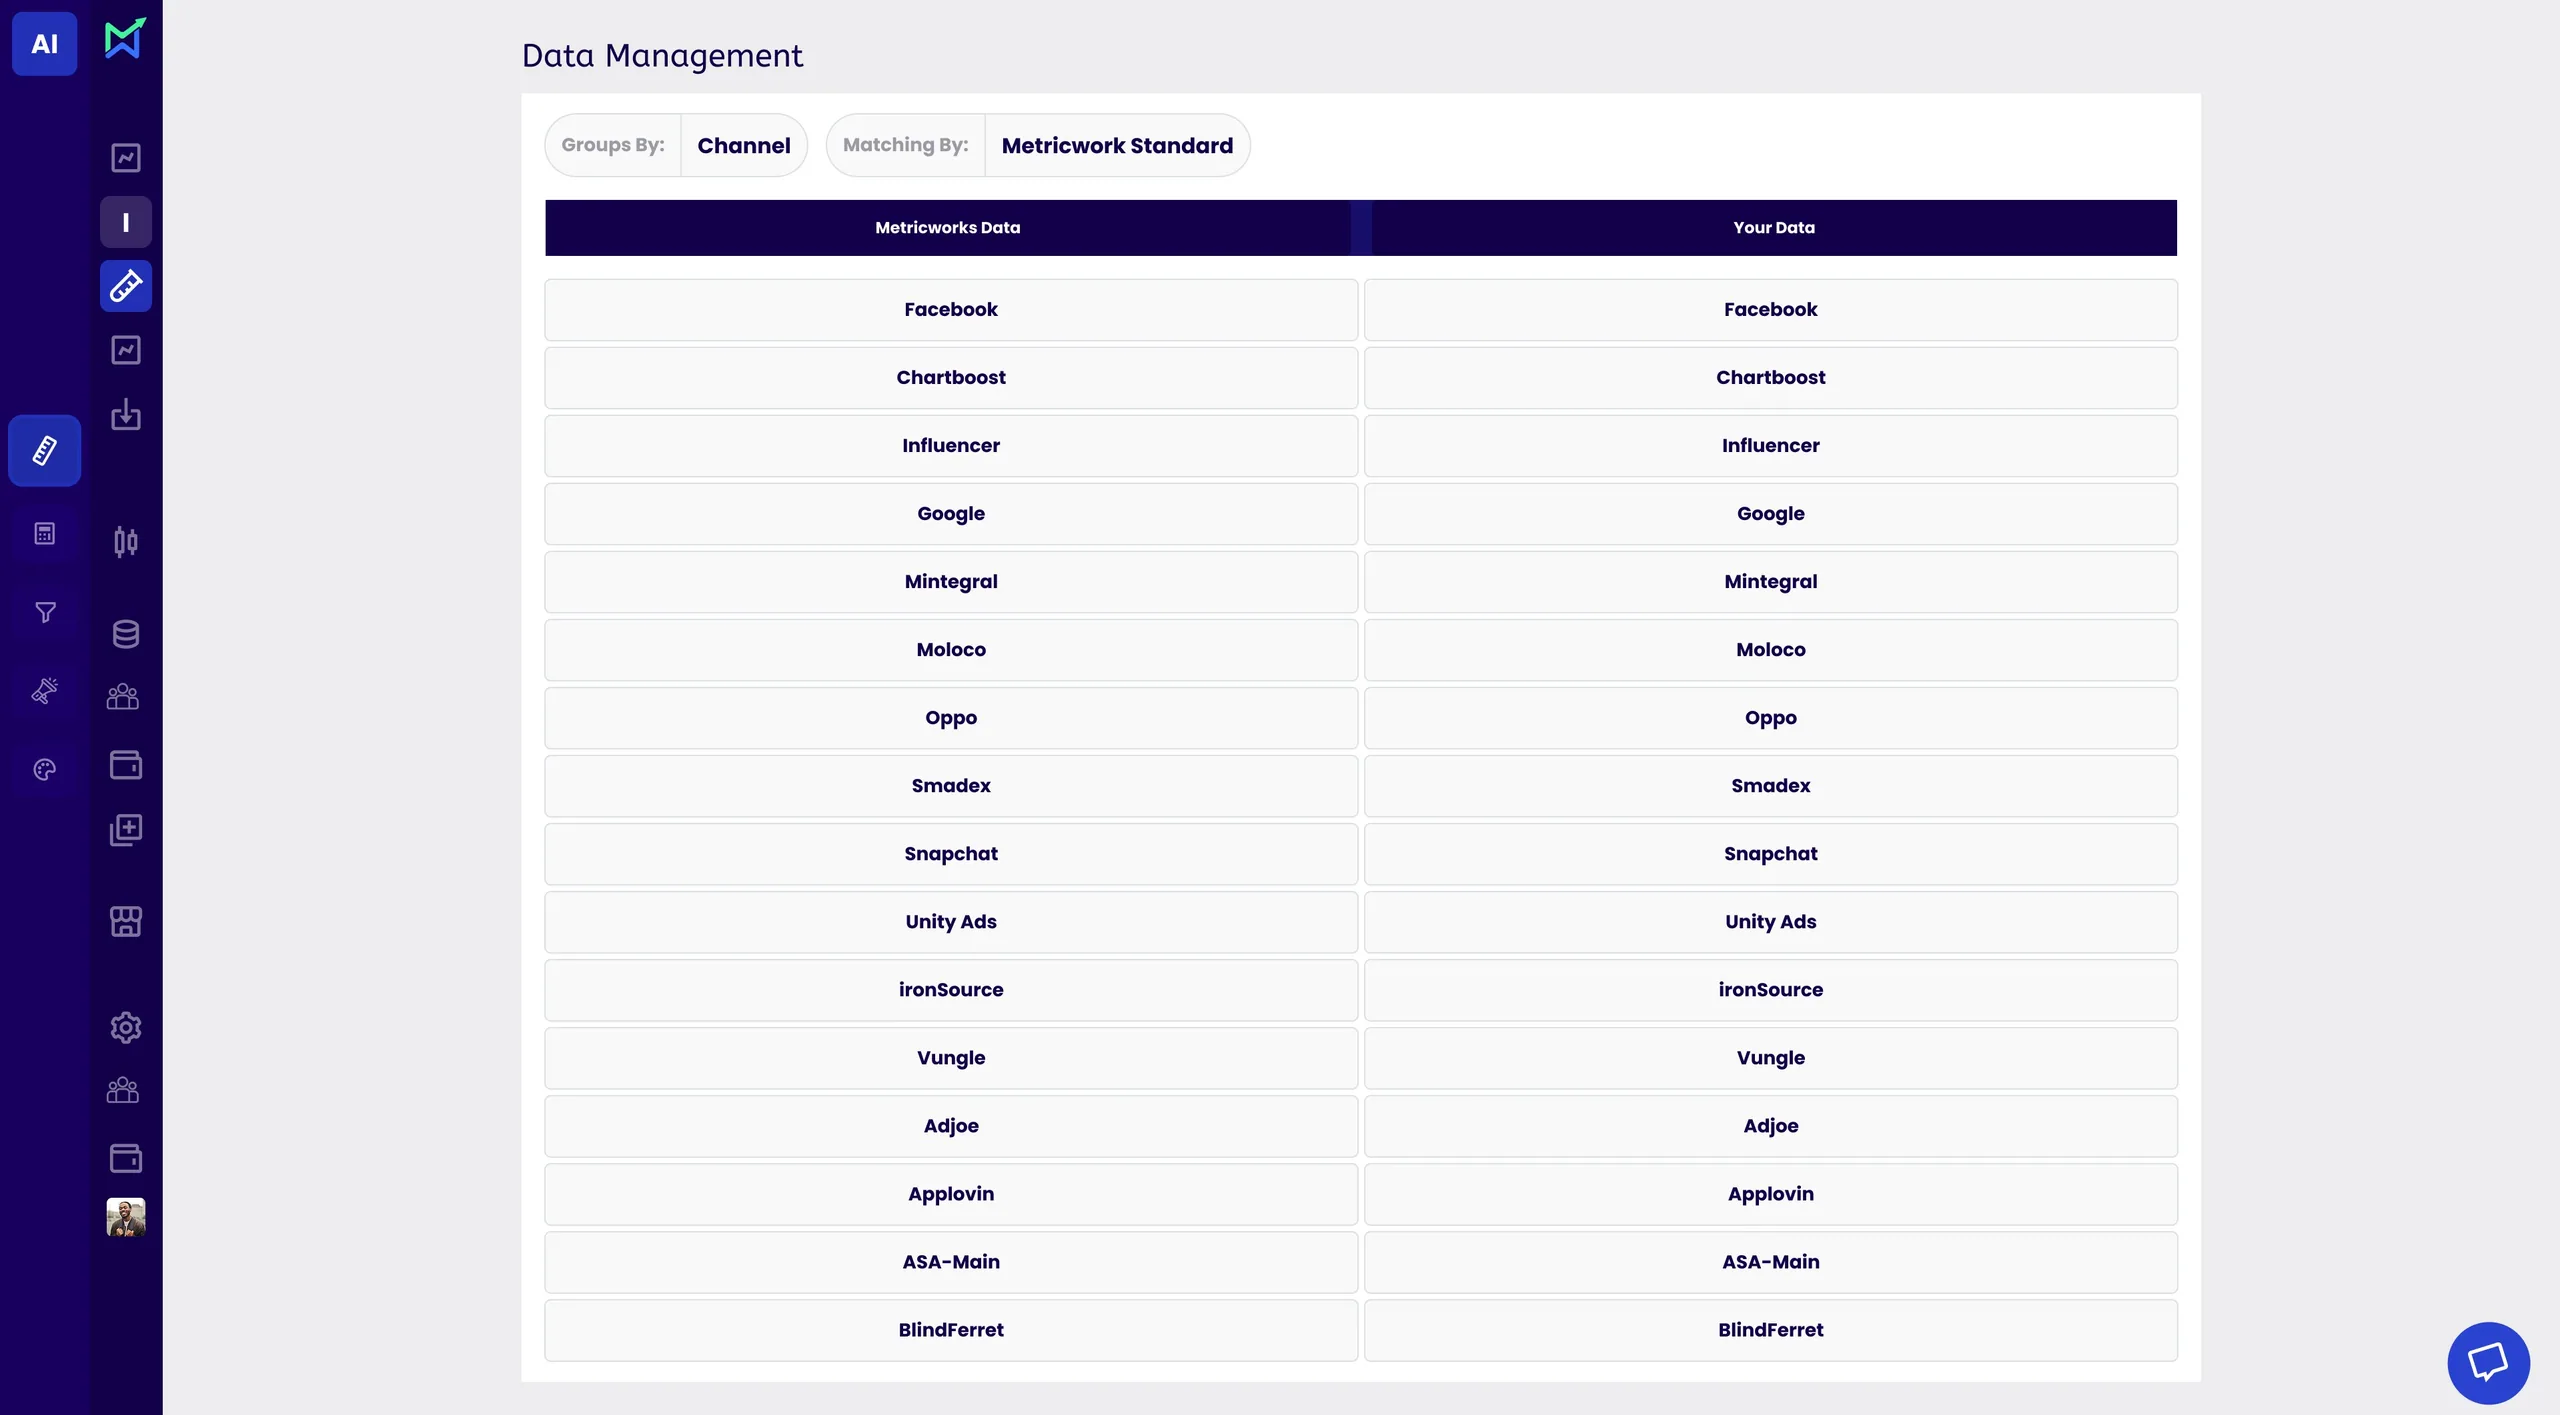
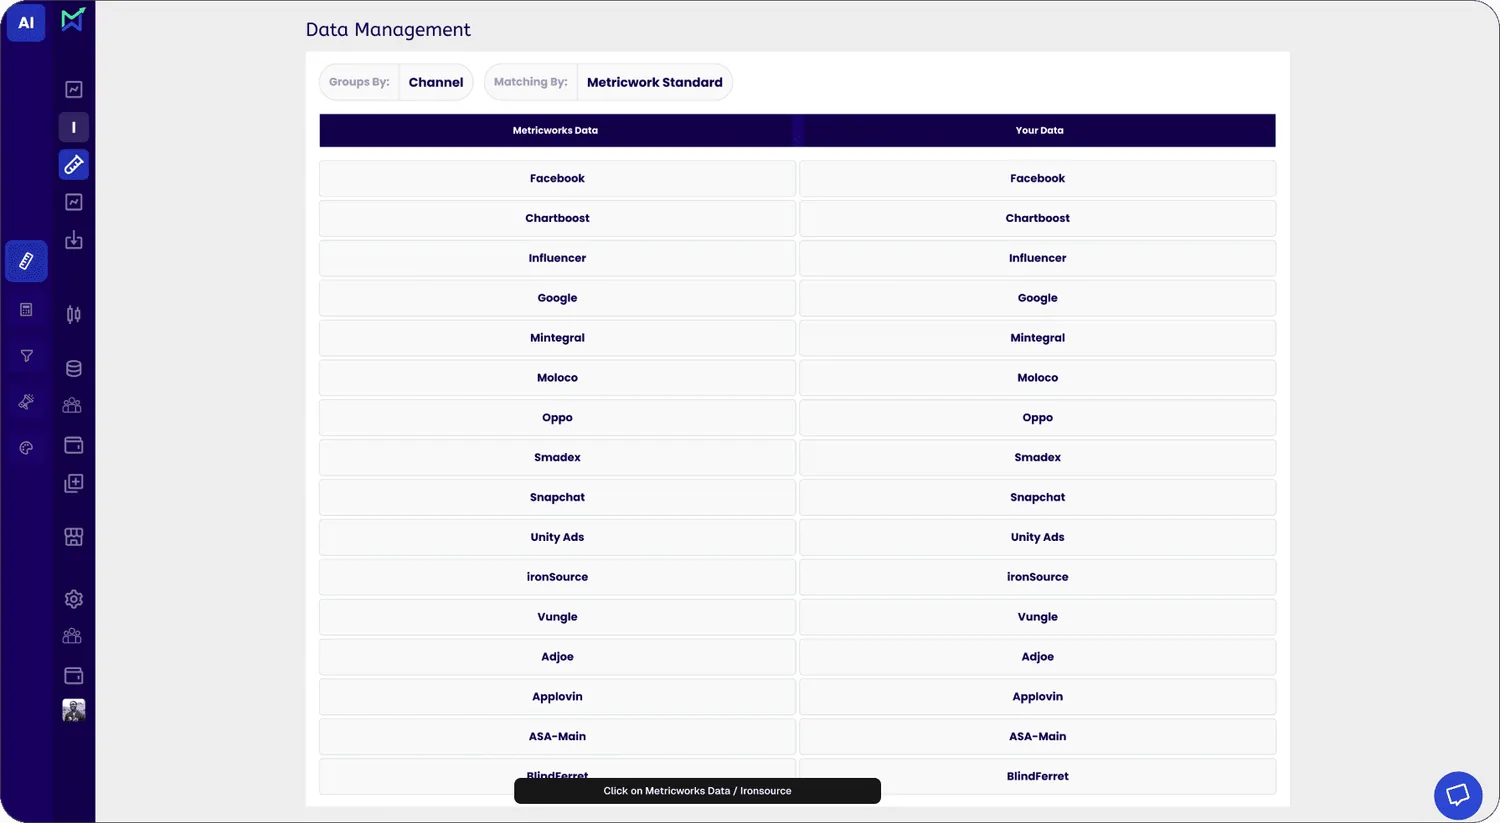
Users needed to align their own data source names with MetricWorks' normalized channel taxonomy before any experiment could run. Mismatched data meant broken results.
I designed a 5-step mapping workflow, select rows, match them, merge into canonical groups. The merged rows disappear from the original columns and live in the Merge Data column as expandable groups. No ambiguity about what's been processed and what hasn't.
Interact with demo Data / Default
Monitor
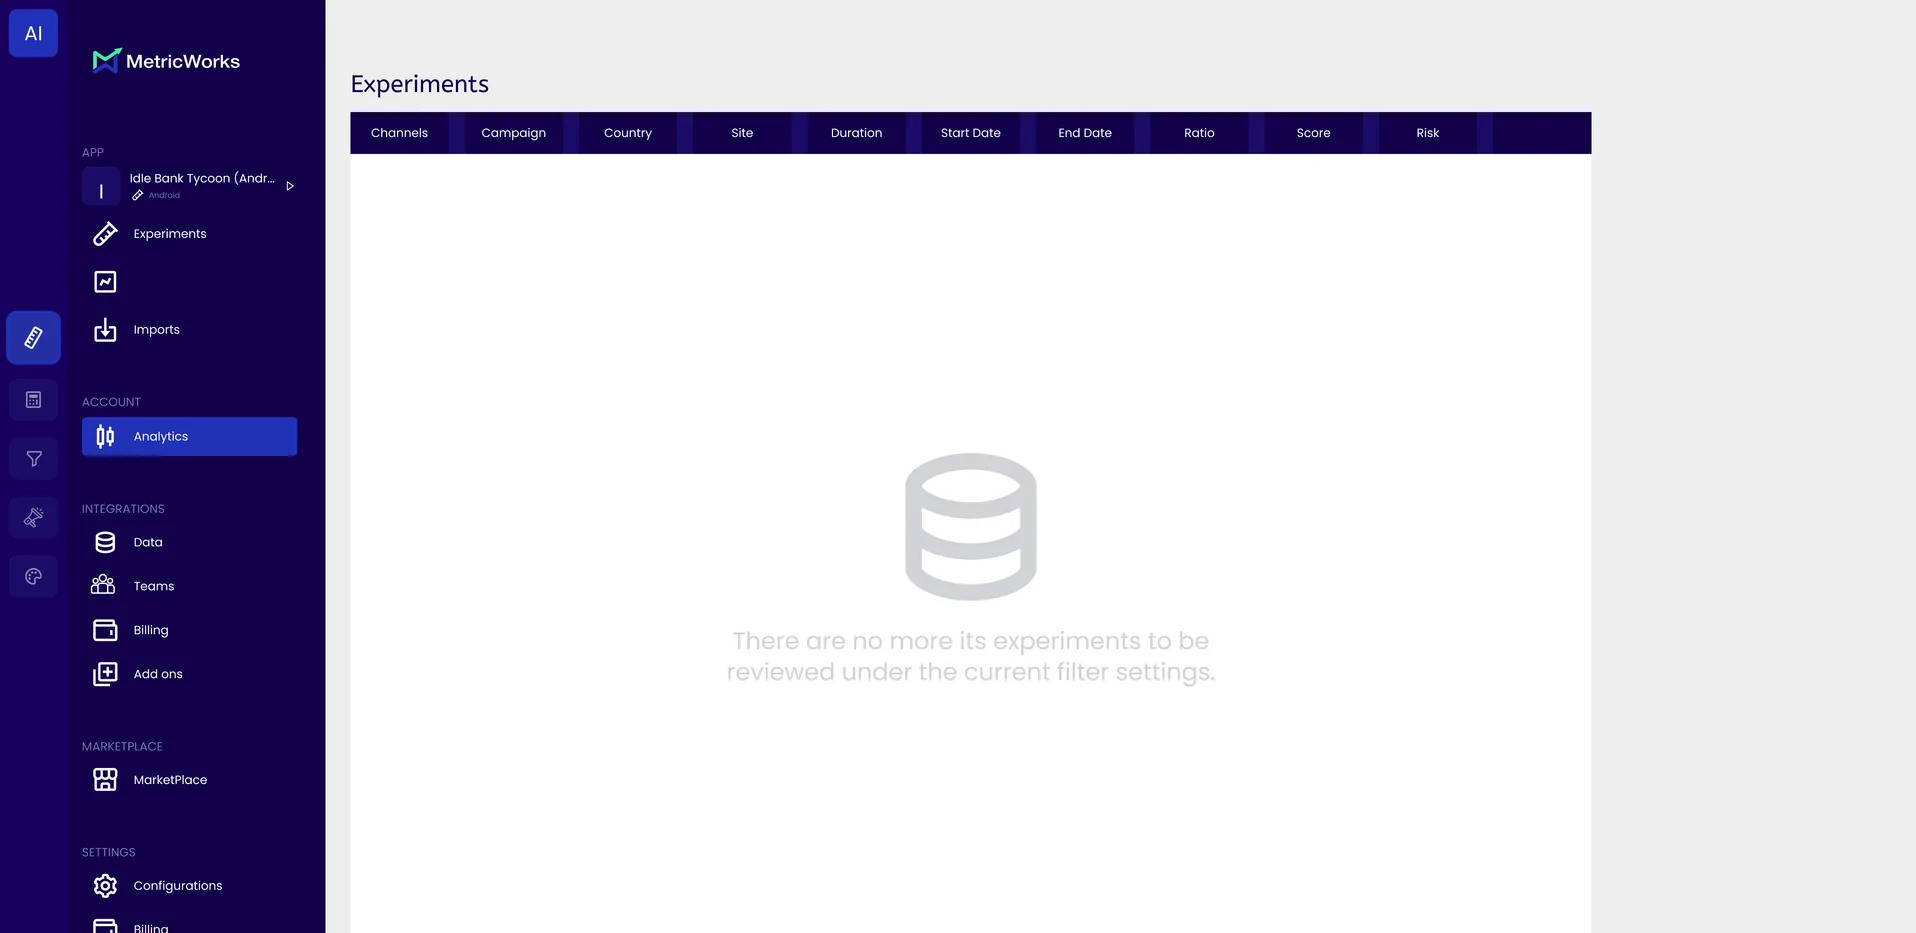
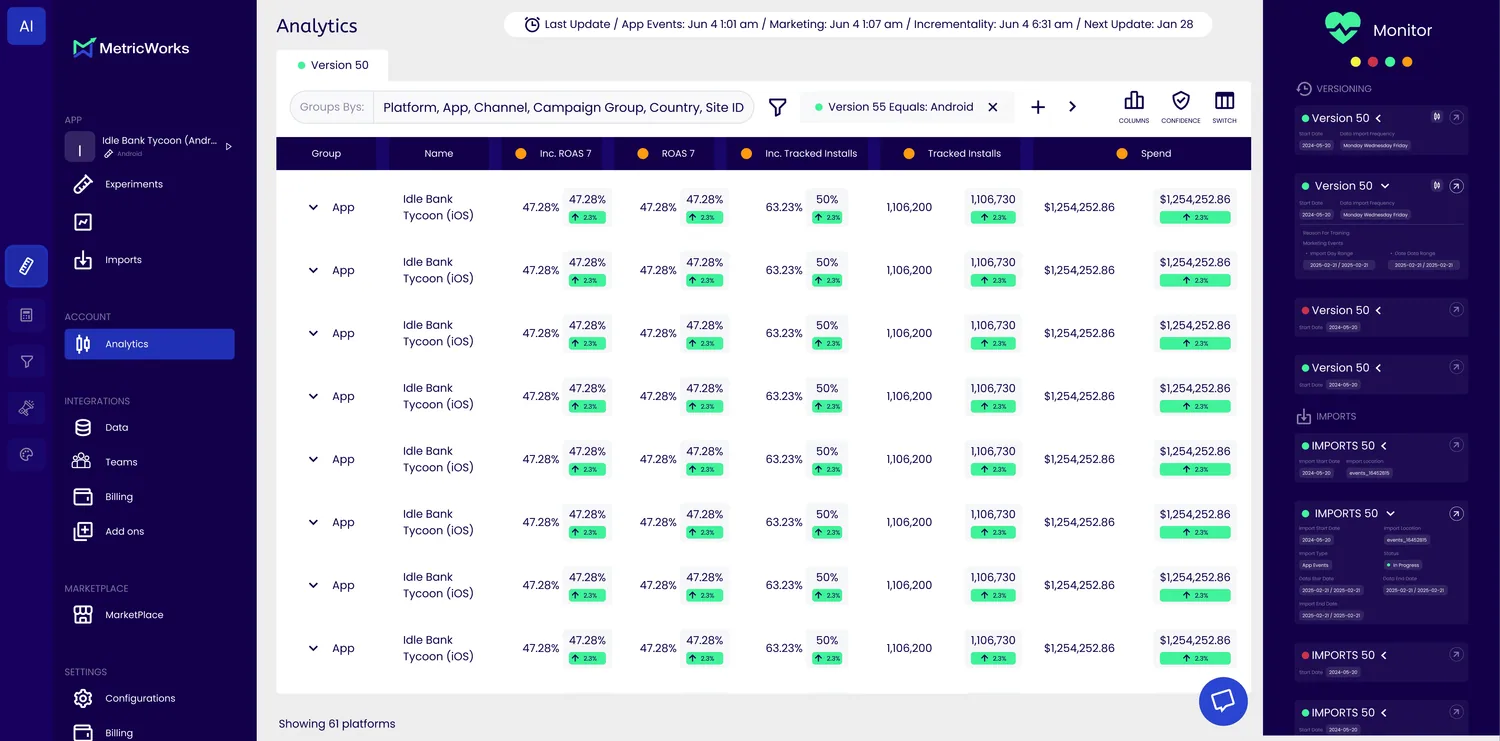
Once experiments are running, teams need to see everything in one place: performance across channels, countries, and products simultaneously.
The Monitor is the highest-traffic screen in the platform. The design challenge was density without noise. How do you show a CMO everything at once without overwhelming them?

Interact with demo Monitor / Default
Synthetic Control
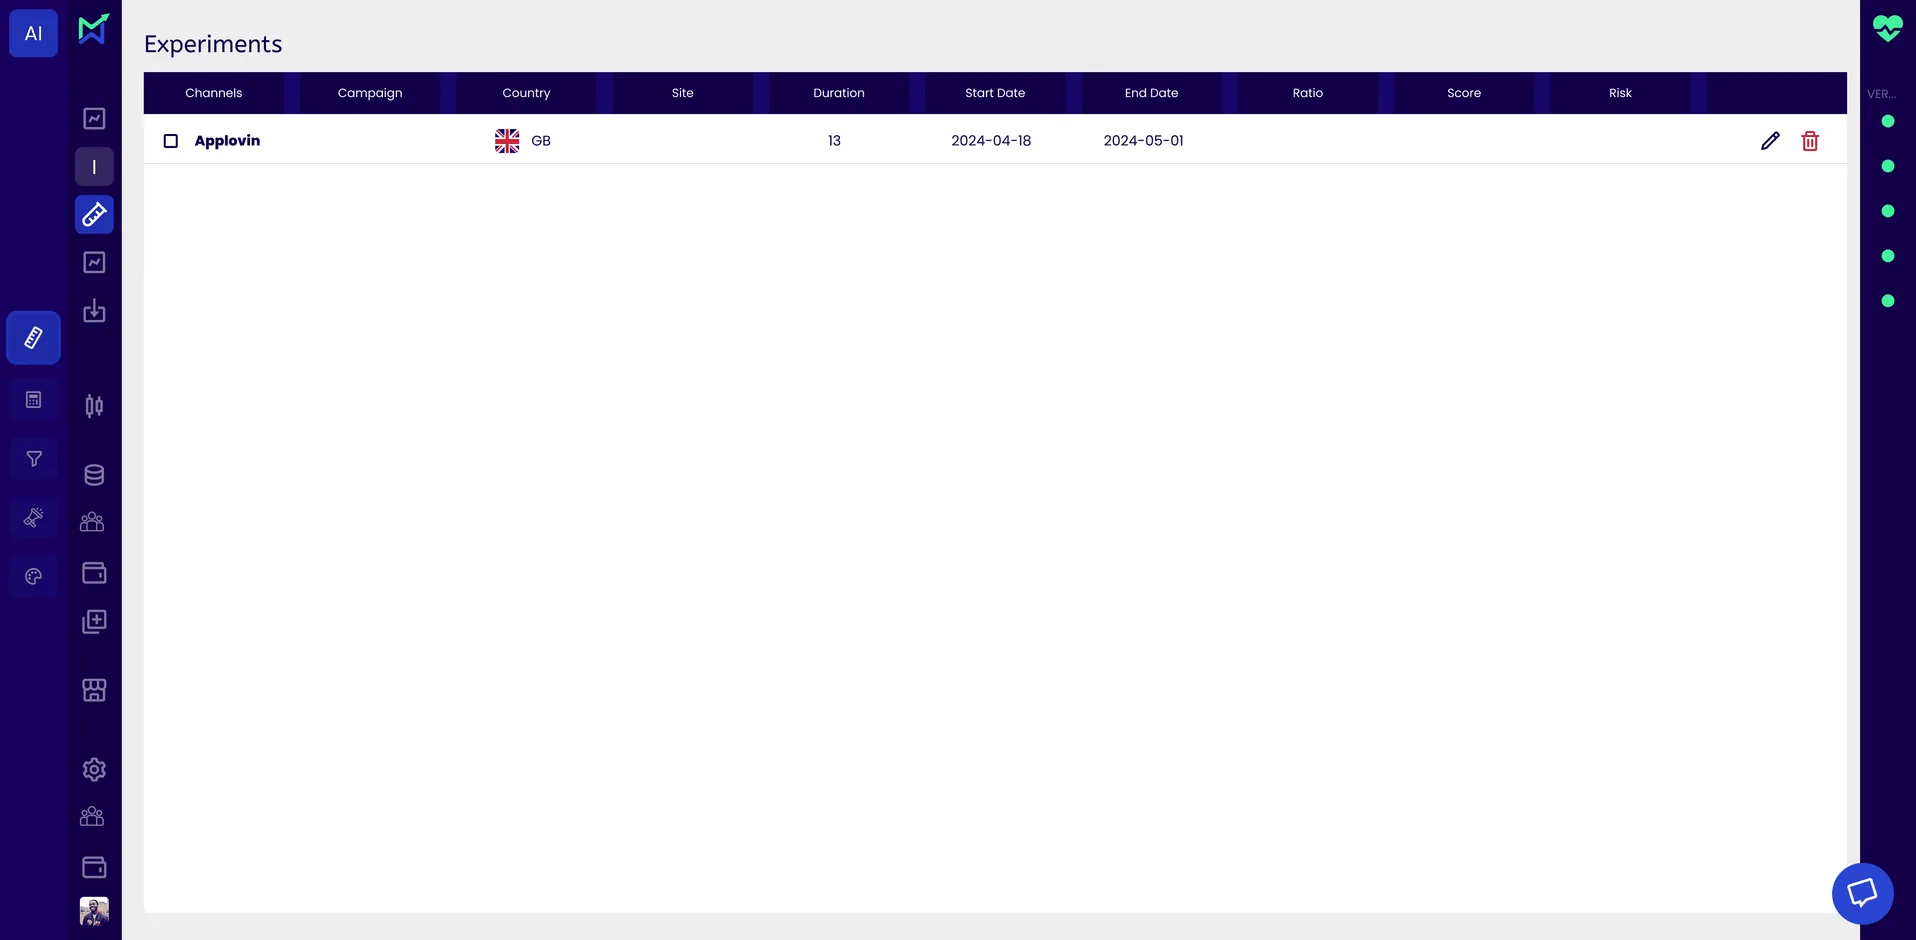
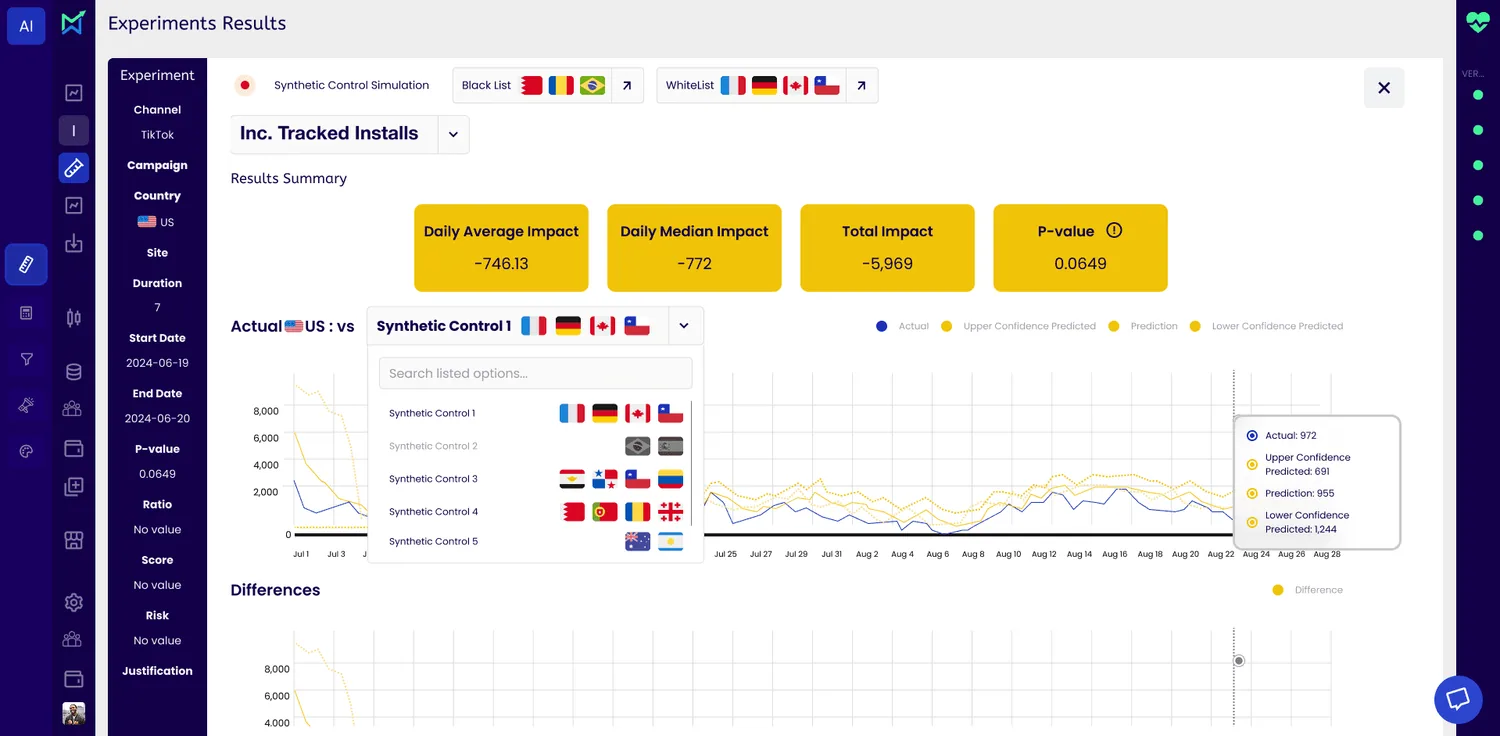
MetricWorks predicts outcomes by comparing your experiment group against a synthetic control, a mathematically constructed baseline. Setting that up involves country selection, blacklists, experiment configuration, and confirmation steps.
A multi-step workflow where one wrong decision corrupts the entire experiment. The design had to make each step feel consequential without creating anxiety.
Interact with demo Synthetic Control / Default
WHAT SHIPPED
More than ten features designed and delivered to a live enterprise platform actively used in market. The most impactful ones:
Monitor
A unified dashboard giving users real-time visibility across every version, import, dataset, and active experiment simultaneously, with filters to surface only what matters at that moment
Synthetic Control Segmentation
Country-level configuration with whitelist and blacklist logic, KPI-level control mapping, and a confirmation step that makes every decision visible before execution
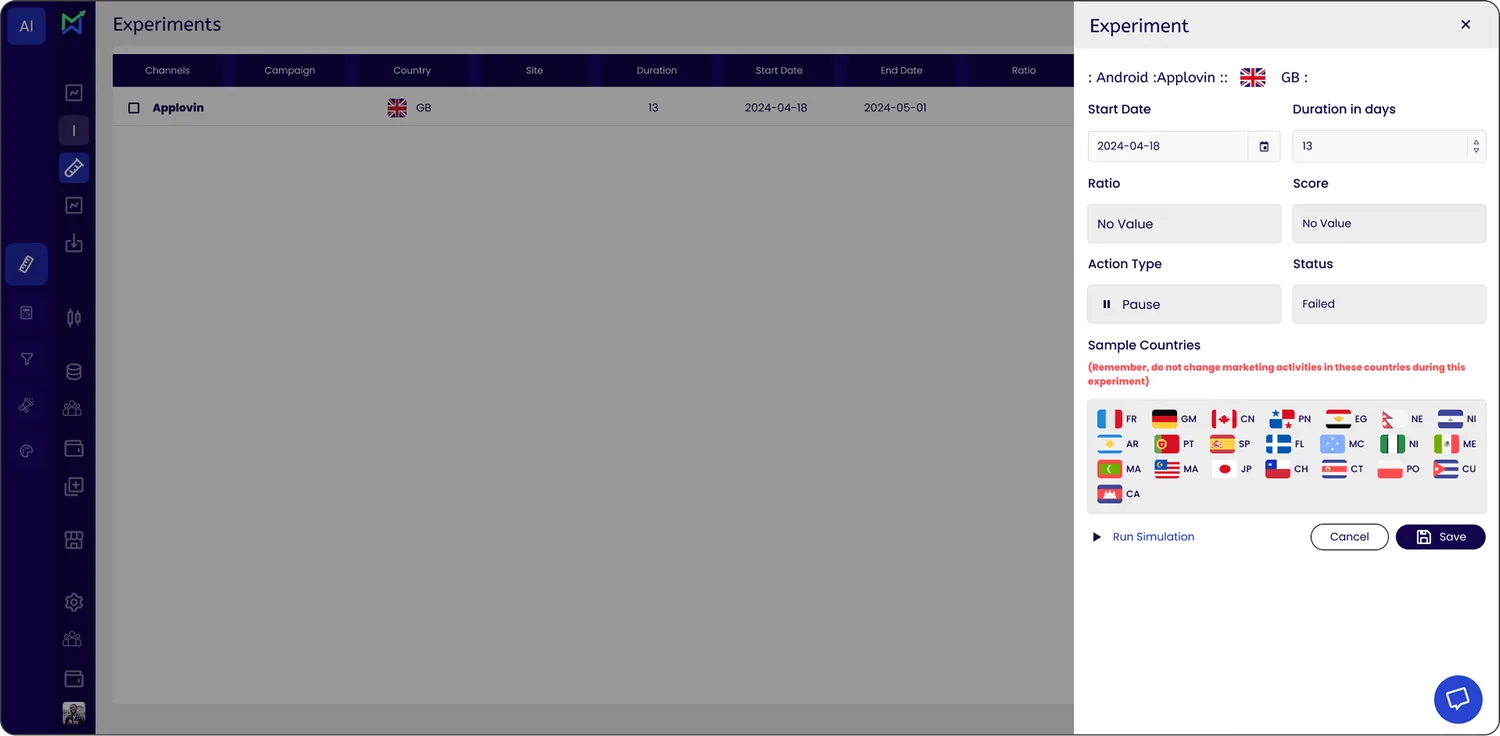
Experiment Creation
A fast, guided setup flow that reduced the complexity of launching a new experiment without removing control from advanced users
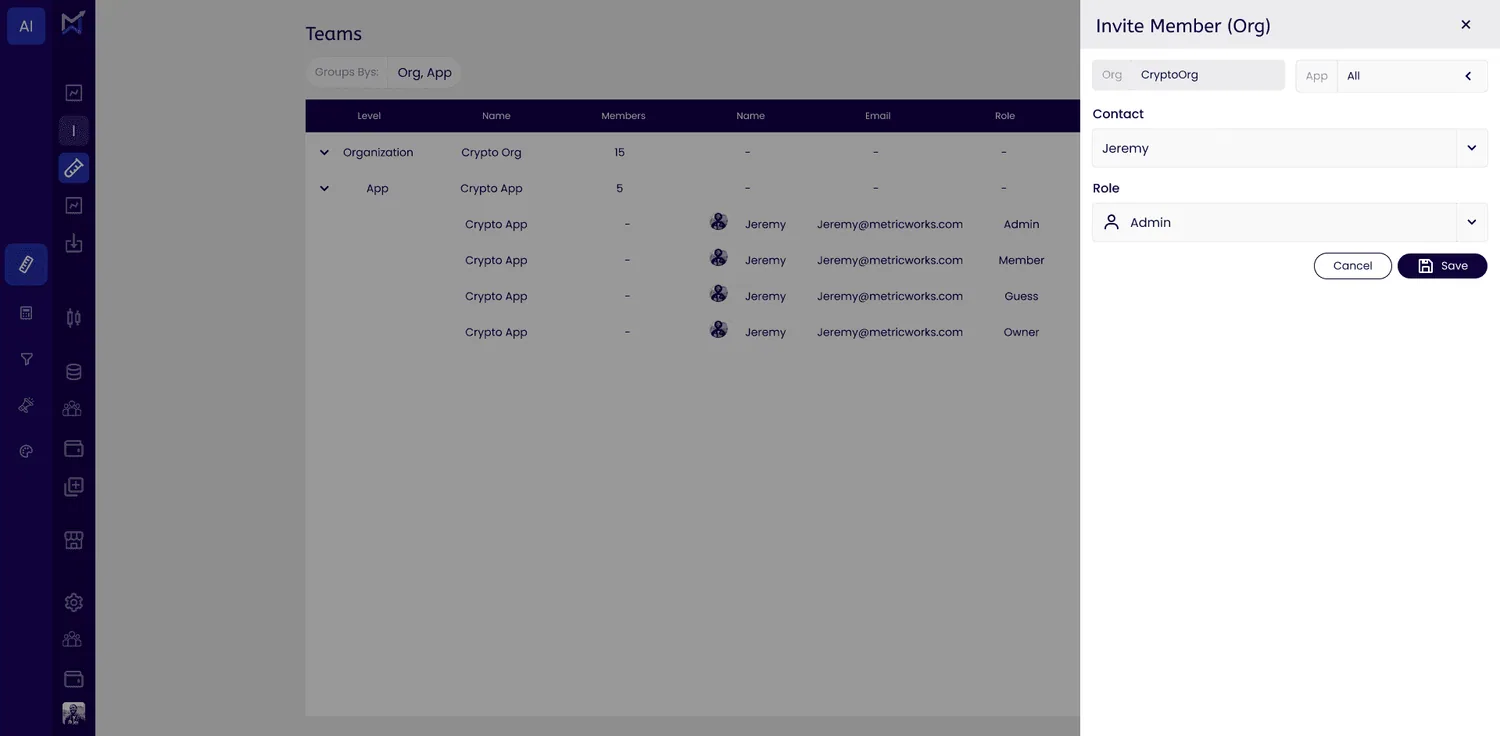
Platform, Org and App Configuration
Structured settings architecture letting teams manage their full environment without engineering involvement
Data Configuration
Tools for mapping and converting external data sources into the MetricWorks taxonomy before experiments run
Dashboard Improvements
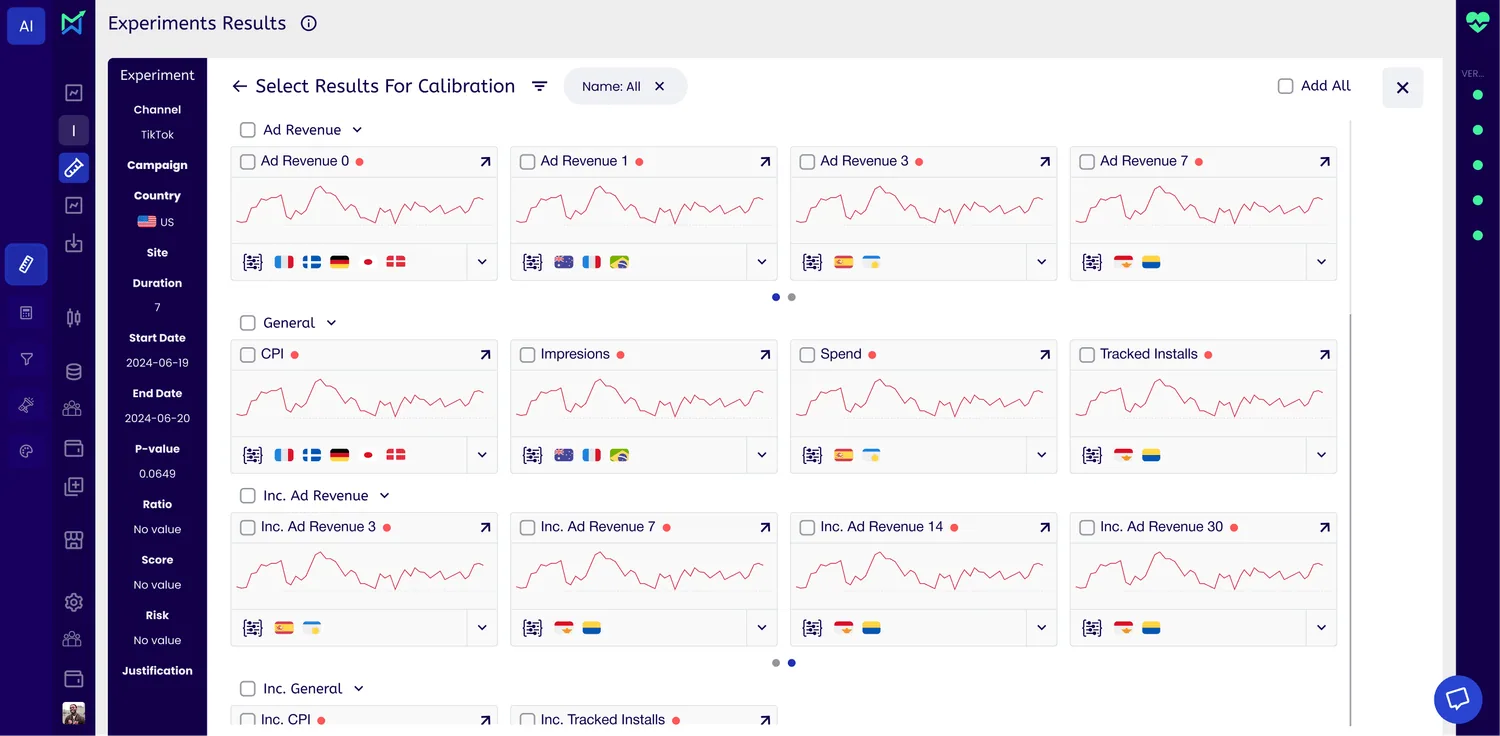
Enhanced KPI filtering and synthetic control visibility showing which experiments are performing and why, through color-coded graphs, country context, and applied control indicators
What I'd Do Differently
Build the design system first.
I was using a style guide from Relume. I didn't know what Figma variables or design tokens were yet, and I was learning on the job. Features moved at a pace that didn't allow for stopping and building infrastructure. The result was inconsistency I had to clean up later. Today I build the token architecture before I touch a single screen.
Be more involved in post-production, not just production.
Features went from Figma to the CTO to production. I never sat with a real user during this engagement. Decisions came from the CTO's product knowledge and my design instinct. Both are good inputs, but neither substitutes for watching someone actually use what you built. One usability session per major flow would have caught things before they became engineering debt.
Speed is not a methodology.
The CTO and I worked fast and close and it felt productive. But moving fast without a framework, no UX mapping, no MoSCoW prioritization, no hypothesis testing, means you're building on instinct instead of evidence. I've since learned that structure doesn't slow you down. It stops you from building the wrong thing quickly.
"MetricWorks taught me that the best client relationships aren't transactional. The CTO who reviewed my Figma files at midnight still advises me on my personal project, and we still work together from time to time."